


Good Morning, Good Afternoon or Good Evening
where ever you are in the world. This is the Sunday and Weekend Edition of
Texas Trade Report reporting for the week of 22-12-2013 thru 28-12-2013. I
am Liz S, your currency analyst for this edition. I will be talking about the EUR/NZD,
AUD/NZD, and CAD/CHF currency pairs, gold and oil in these week report. This is
sole focus of this report. Before I can go any further, here is the risk
disclaimer.
Risk Disclaimer:
Trading Forex is a risky business and sometimes you will lose the money that you traded. You are leveraged 50:1 or even more. There is the risk of loss of the money have invested. Never invest money that you are not committed losing. There is a possibility of losing your original investment. If you are not sure about investing, seek the help of a registered investment adviser.
Also, the purpose of this trading lesson is education. This does not constitute trading advice. Nor do I give out trading signals. All opinions are my own and not Blogger.com nor Google.com.
 |
| EUR/NZD Daily Chart |
Onto the focus of this week’s report, EUR/NZD
is the first pair that I will be looking at for this report. On Friday, we
closed at 1.6663. This pair is trading sideways and look like it would like be
on downward trend. The fib levels are
1.6272 at 50% level and 1.6500 at 61.8% level on the daily chart. I don’t
expect this go higher short term. There is not going to be a lot of economic
activity. Because the western world does celebrate Christmas on December 25th.
I do expect the conditions for trading to be less liquid. We could see some
giant moves because the illiquidity. It is not uncommon to see such moves
happen around this time of year. There are not any major reports for the EU. I
am bearish on this pair going forward for the short term.
 | |||
| CAD/CHF Daily Chart |
Onto the CAD/CHF, we close at 0.8414 on
Friday. This pair has been trending downward for some time. This pair does
seemed to be bottoming out. It made a low at 0.8308. This pair starting to perk up. I had said a
little while ago that I thought it would and appears that we are starting to
get some movement in that direction. I am being cautious at this point.There
are many trades and analysts out there ready to short the CAD. I am not in that
camp because the chart is not showing that it happening at this point. I
believe this pair is due for a much needed bounce. The level to get above is at
the 0.8595 level on the daily chart. It is at 23.6 fib level, as well. I
believe that we are going to go higher eventually. I believe that it will
happen. I am bullish at this point. The only report coming out for Canada is
the GDP economic report at 13:30 GMT on Monday,23 December. We could see some volatility
on this report. After Monday, there is not much economic activity.
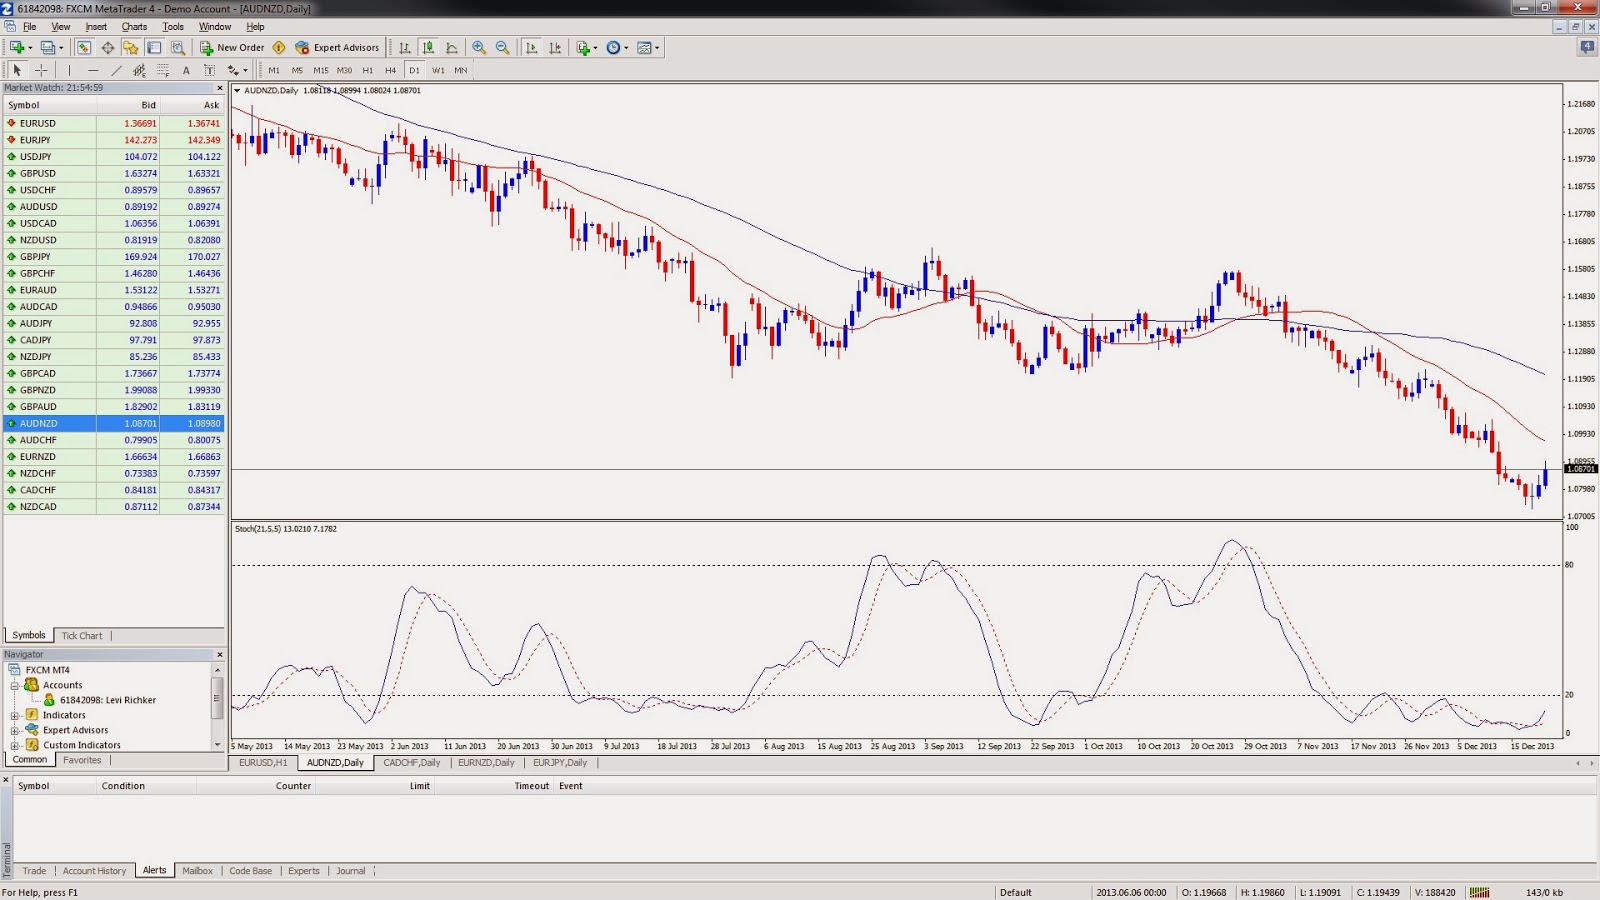 |
| AUD/NZD Daily Chart |
Onto the AUD/NZD, this pair has been trading
downward for a good part of this year. We closed on Friday at 1.0870. I do
expect a bounce on this pair. The 23.6 fib level is at 1.1069 and 1.1279 at
38.2 percent fib level on the daily chart. The 50% fib level is at 1.1452 and
61.8 is 1.1620 on the daily chart. This pair is not very fast moving. I am
neutral until we can break above the 23.6 fib level on the daily chart.
 |
| Gold Daily Chart |
Onto gold, we closed on Friday in the
positive and at $1202.4. Gold closed $8.80 higher. Gold has been getting
crushed. It has been trending downward for a while. I don’t expect a lot of volatility
in the gold market for this because the Christmas holiday. The fib levels on
the daily chart are $1252.02 at the 23.6, $1268.13 at the 38.2% fib level, $1292.50
at the 50% level, at $1331.23 at 61.8 fib level on the daily chart. I am
expecting that gold will bottom soon and could be due for a bounce in gold for
the time being. I am neutral at this point until we can break above the 38.2%
fib level.
 |
| Oil Daily Chart |
Onto oil,
it closed at $99.17 on Friday. It is still looking bullish at this point for
oil. It looks like it may break the down trend. It appears to be doing so. I am
very bullish on oil. The key area to watch for is the $99.55 area of resistance.
I believe to that it will break above a $100 a barrel. The next level of
resistance on the daily chart is $104.12 resistance area.
No comments:
Post a Comment