


Good
Morning, Good Afternoon or Good Evening where ever you are in the world. This
is Texas Trade Report for 23 December 2013. I am Liz S, your
currency analyst for this daily edition. I will be talking about the AUD/CHF, NZD/CAD,GBP/CAD
currency pairs, gold and oil in this daily report. This is sole focus of this
report. Before I can go any further, here is the risk disclaimer.
Risk Disclaimer:
Trading Forex is a risky business and sometimes you will lose the money that you traded. You are leveraged 50:1 or even more. There is the risk of loss of the money have invested. Never invest money that you are not committed losing. There is a possibility of losing your original investment. If you are not sure about investing, seek the help of registered investment adviser.
Also, the purpose of this trading lesson is education. This does not constitute trading advice. Nor do I give out trading signals. All opinions are my own and not Blogger.com nor Google.com.
 |
| AUD/CHF Daily Chart |
Onto the AUD/CHF,
this pair had made it as a high to 0.8008 the daily chart. It is currently
trading at 0.7993. This pair has been trending downward for some time. There
are not major economic reports for Australia and Switzerland. We have very
quiet markets The fib levels at 23.6% level are 0.8260 and 0.8528 at 38.2 fib
level. At 50.0 % fib level is 0.8749. At 61.8 fib level is 0.8966. This pair is
due for a bounce. It is starting to. We need more confirmation at 38.2 fib
level to become bullish and that it stays above it. I am neutral until we can
get above 23.6%.
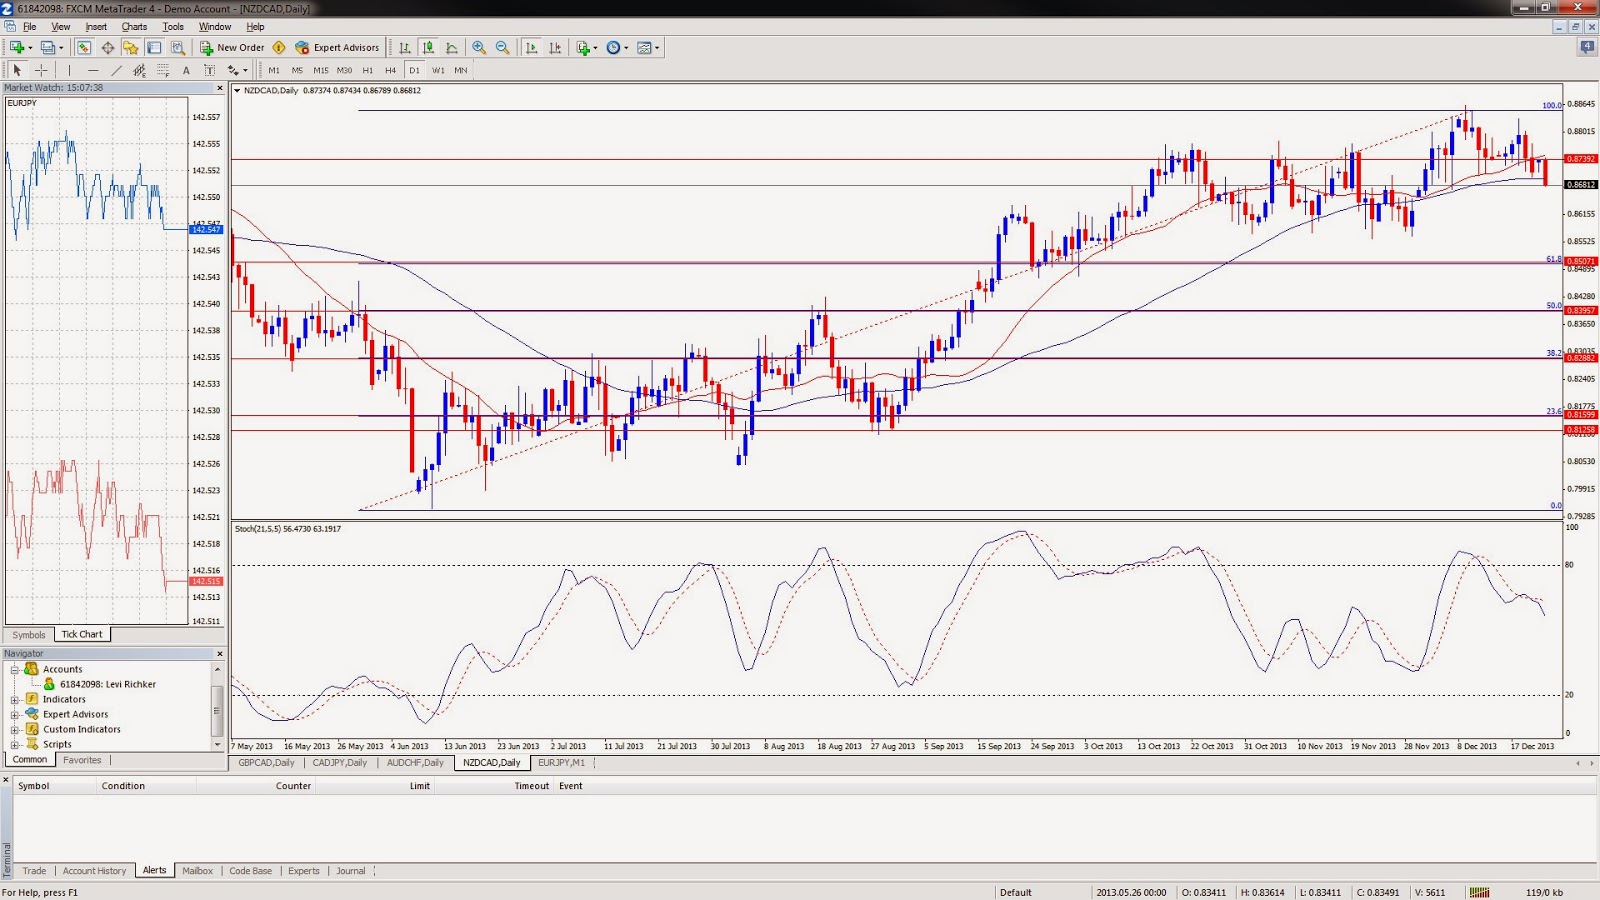 |
| NZD/CAD Daily Chart |
Onto the
NZD/CAD, this pair has been trending slightly up and is currently trading at. This
pair made a high of 0.8739. It continues to trend downward for the time being. It
is currently trading at 0.8684. There are not major economic reports for New
Zealand and Canada. The fib levels are for 23.6% at 0.8159 and 38.2% fib level
at 0.8288 on the daily chart. At 50.0% fib level is 0.8395 and at 61.8% fib
level at 0.8507. This pair does appear that it wants to go to the downside.
This pair has been trading sideways for some time. It is starting its downward
path to the 61.8% fib level at 0.8507. I am bearish on this pair for the short
term and medium.
 |
| GBP/CAD Daily Chart |
Onto the GBP/CAD,
this pair has been trending up. It is currently trading at 1.7303. It made a
high of 1.7431. We do expect soon a retest around the 1.7014 area of support on
the daily chart. It will confirm the bullish trend on the daily chart still
holds. The stochastics are indicating downward movement and appear that
downward pressure is taking hold on the pair for right now. The key fib level
for 23.6% are 1.6002 and at 38.2% fib level is 1.6301. At the 50.0% fib level, it
is 1.6548 and at the 61.8% fib level 1.6781. We do hold that this levels to
have to be hit in the near future. The
most likely fib level is 61.8 at 1.6781 price level. I would like to see
retracement towards there to confirm the bullish trend overall. I am still
bullish on this pair for the short and medium term.
 |
| Gold Daily Chart |
Onto
gold, it is down about $3.40. It is currently trading at $1200.20. I believe
that break above the $1265.95 and stay above it that would be bullish. Gold has
been trending downward for most of this year. We have been trending down for
today. This may not continue forever. The gold market is very quiet at the
moment. The Christmas holiday could spark the same conditions of liquidity that
we see with currency pairs for the Christmas holiday. At this point, my overall
viewpoint for the short term is neutral until we can break above the 1265.95
area.
201312312.png) |
| Oil Daily Chart |
201312312.png)
Onto oil,
it is currently trading at $99.01 a barrel and is down a little bit. It is down
by 0.44%. The key fib levels for oil at 50.0% at $100.62 and 102.79 at 61.8 fib
level on the daily chart. It has broken about 38.2% fib level at 98.60. It has
to break above $99.77. $99.77 is the new area of resistance for the time being.
Then, there is overall area around the $104.00 resistance area. I believe that
it will break above that area. I am firmly bullish on oil at this point.
The
overall markets are bullish at this point. Risk themes will continue to play
out. I want to emphasize there will be less liquidity in the markets and
caution is advised at this point due the illiquid markets taking place today
and tomorrow. I will put out another report tomorrow. Take care and good luck
trading for the rest of today.
No comments:
Post a Comment